First you can only debug JavaScript, there is no support for debugging FormCalc scripts. Second, you can only set breakpoints in event handlers, you can step into a script object but you can't set a breakpoint in one and the JavaScript debugger will not show you the code being debugged. It will at least show you which line number you are on and the JavaScript debugger console will allow you to display the values of form object properties and variables.
To set a breakpoint you must open the form in Acrobat, the Preview PDF within Designer does not seem to support all the debugging functionality available. The simplest way to do this is to perform a Preview PDF, Designer will generate a temporary file in your temp directory with a random name. So in Adobe Acrobat you can go File ... Open ... then type "%temp%" (without the quotes) in the File name field click the open button and find the most recent PDF file with a randomly generated name something like "_165o26cev28fbb2ut.pdf".
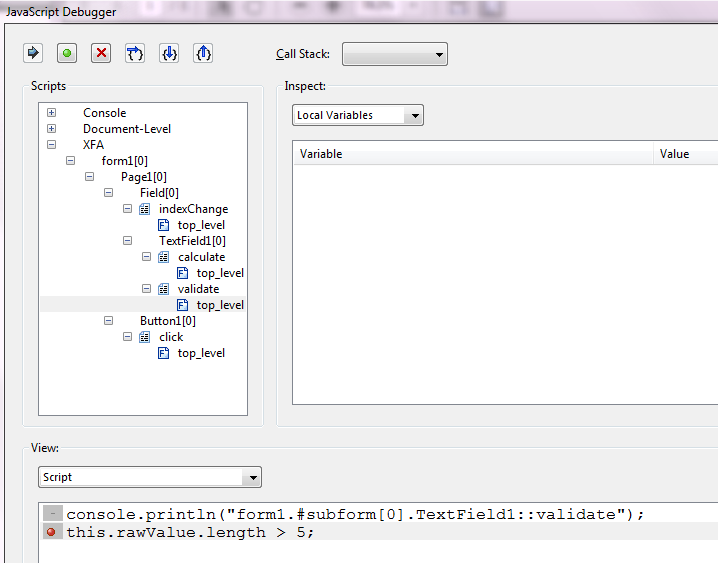
Once open in Acrobat the JavaScript debugger will now display the Hierarchy of the form, you will be able the expand the XFA node and navigate to a piece of event code and set a breakpoint, like this one on line 2 of the validate event of TextField1, just click where the red dot is.
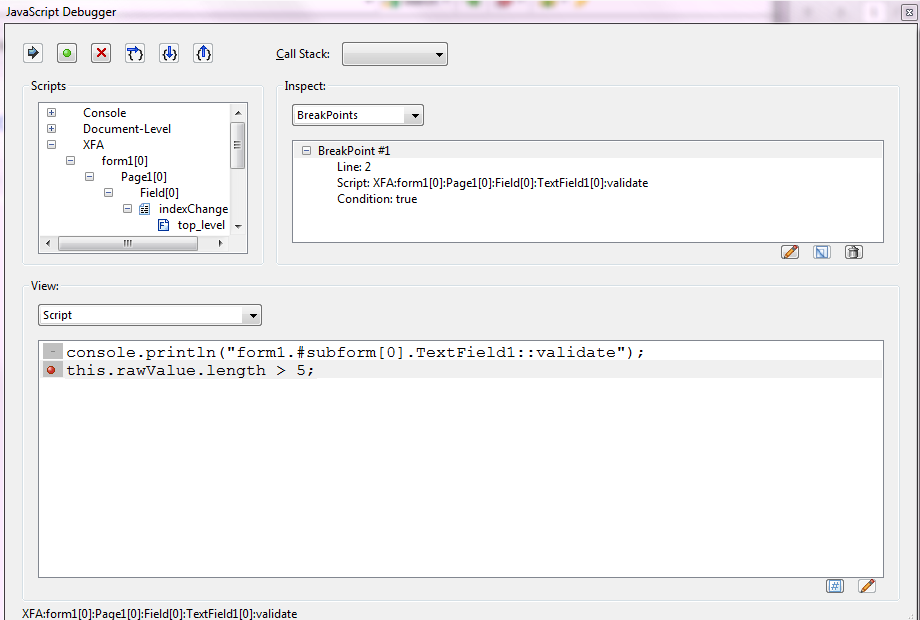
To see all the breakpoints you have set select BreakPoints in the Inspect: drop down (which will have defaulted to Local Variables), this will display all the current breakpoints, in this case we only have one so it looks like;
If you want to make the breakpoint conditional, select the breakpoint and click the edit button;
This will bring up a "change the breakpoint condition to:" dialog, like;
The default condition is true (so always breaks) but you can enter any JavaScript expression that resolves to true or false. So in this example we could type this.rawValue.length == 3 and the breakpoint will only be hit when we validate the field and it has a three character long value.
You can also list all the breakpoints using the JavaScript console. In the View drop down select console and type the following (to execute select the snippet and use the Ctrl-Enter on the numeric keypad);
for ( var i = 0; i < dbg.bps.length; i++ )
{
console.println(dbg.bps[i].toSource());
}
{
console.println(dbg.bps[i].toSource());
}
This will display something like;
({fileName:"XFA:form1[0]:Page1[0]:Field[0]:TextField1[0]:validate", lineNum:2, condition:"this.rawValue.length == 3"})
Then you can use the following to clear the breakpoint
dbg.cb({fileName:"XFA:form1[0]:Page1[0]:Field[0]:TextField1[0]:validate", lineNum:2})
And to set the breakpoint again you can use;
dbg.sb({fileName:"XFA:form1[0]:Page1[0]:Field[0]:TextField1[0]:validate", lineNum:2, condition:"this.rawValue.length == 3"})
The dbg object also has methods for step into, step over, step out, etc but it is generally easier to use the toolbar of the JavaScript Debugger.


