One of the little mysteries with working Acrobat JavaScript is how the JavaScript console handles string literals.
If you open Acrobat and then the JavaScript console, (using Ctrl-J) and type
'abc'.length .. we get a response of 3
and
“abc”.length .. also gives a response of 3
But if we are using the JavaScript console when performing a PDF Preview from LiveCycle Designer then
'abc'.length .. still gives us 3
but
“abc”.length .. returns undefined
Even worse
'a"b"c'.length .. also returns undefined, (that is a double quote within single quotes)
So it seems we can’t use double quotes at all, but we can you just need to escape them (even though JavaScript should not require us to), so
'a\"b\"c'.length .. returns 5
This doesn’t cause problems daily but every now and then … maybe if I’m having trouble with a SOM expression involving a predicate, say something like
Content.dataNode.resolveNode('$.Location.[Level == "Lead"]')
Showing posts with label Tip. Show all posts
Showing posts with label Tip. Show all posts
Thursday, 9 April 2015

Thursday, 12 March 2015
Adobe LiveCycle Designer Tip #8 - Bringing colour to your workspace (and other settings)
I recently received an upgraded computer, which meant I had to re-install LiveCycle Designer ... and find all my settings again.

Increase the number of files in the Recently Used File List to 10. This seems to be the maximum, although there is no error when a higher number is entered the value will not be saved.
Set the Create Backup Copy on Save, this will create a _BAK.pdf file (or a _BAK.xdp file) which gives you a chance to recover your work if Designer crashes on you. The disadvantage of setting this option is when you edit a fragment the _BAK file will be created and the fragment will be duplicated when viewed in the fragment library. Another way you can recover your work if Designer crashes to look for a PDF file in your Windows %temp% directory with some random looking name _1f7o26cap4d25e8q1t.pdf this is the file that is created whenever you perform a PDF Preview.

Under JavaScript Syntax Formatting ... select a custom color for strings and numbers, I use an orange color. I used to have a boss who set his to red, he never wanted to see any red. I'm not that strict so set mine to an orange. The idea is to make you think if these values would be better off in a form variable or a dataset.
Select the Show Line Numbers checkbox, any runtime errors will refer to a line number so showing line numbers makes it easier to find the right line. Just make sure there are no blank lines at the start of your script as these aren't counted when line numbers are displayed in error messages.
 Set the Show Dynamic Properties checkbox, this will enable the option to bind values in a drop down to the data connection
Set the Default Binding for New Subforms to "No Data Binding"

Deselect the Snap to Grid option to allow finer control over the form objects, typically I use flowed subforms but even with a positional subform it is usually easier to align with another object, under the Layout menu or learn the keyboard shortcuts, Ctrl-LeftArrow to align a group of fields on there left boundary, etc.

Add Ctrl-Shift-w for Warp in Subform and Ctrl-Shift-u for Unwarp Subform. The default keyboard shortcuts are listed in Using Designer ES4 / Working with the Keyboard / Default keyboard shortcuts
Tools ... Options ... Document Handling
Increase the number of files in the Recently Used File List to 10. This seems to be the maximum, although there is no error when a higher number is entered the value will not be saved.
Set the Create Backup Copy on Save, this will create a _BAK.pdf file (or a _BAK.xdp file) which gives you a chance to recover your work if Designer crashes on you. The disadvantage of setting this option is when you edit a fragment the _BAK file will be created and the fragment will be duplicated when viewed in the fragment library. Another way you can recover your work if Designer crashes to look for a PDF file in your Windows %temp% directory with some random looking name _1f7o26cap4d25e8q1t.pdf this is the file that is created whenever you perform a PDF Preview.
Tools ... Options ... Workspace
Under JavaScript Syntax Formatting ... select a custom color for strings and numbers, I use an orange color. I used to have a boss who set his to red, he never wanted to see any red. I'm not that strict so set mine to an orange. The idea is to make you think if these values would be better off in a form variable or a dataset.
Select the Show Line Numbers checkbox, any runtime errors will refer to a line number so showing line numbers makes it easier to find the right line. Just make sure there are no blank lines at the start of your script as these aren't counted when line numbers are displayed in error messages.
Tools ... Options ... Data Binding
Set the Default Binding for New Subforms to "No Data Binding"
Window ... Drawing Aids
Deselect the Snap to Grid option to allow finer control over the form objects, typically I use flowed subforms but even with a positional subform it is usually easier to align with another object, under the Layout menu or learn the keyboard shortcuts, Ctrl-LeftArrow to align a group of fields on there left boundary, etc.
Tools ... Keyboard Shoutcuts
Add Ctrl-Shift-w for Warp in Subform and Ctrl-Shift-u for Unwarp Subform. The default keyboard shortcuts are listed in Using Designer ES4 / Working with the Keyboard / Default keyboard shortcuts
Wednesday, 28 January 2015
Adobe LiveCycle Designer Tip #7 - Formatting Tooltips
With the tooltips available with LiveCycle Designer there is no options to add formatting to a tooltip. You can try using a subform and dynamically position it next to the field, like this sample Season Planner (or Year Planner) PDF Template.
One thing you can do is add some carriage returns to add some vertical space. For a long time I was doing this by editing the XML Source and adding a carriage return character "
" in the toolTip value.
But you can do the same thing from the Accessibility palette by using a ctrl-Enter key combination.
Seems everywhere you can enter a rich text value you can use shift-Enter but maybe because the Tool Tip value in the Accessibility palette is not rich text we have to use ctrl-Enter.
You can also gain some control over the tooltip width by using a non-breaking space (Ctrl-Shift-Space, which inserts a 0xc2a0 character) instead of a normal space.
One thing you can do is add some carriage returns to add some vertical space. For a long time I was doing this by editing the XML Source and adding a carriage return character "
" in the toolTip value.
But you can do the same thing from the Accessibility palette by using a ctrl-Enter key combination.
Seems everywhere you can enter a rich text value you can use shift-Enter but maybe because the Tool Tip value in the Accessibility palette is not rich text we have to use ctrl-Enter.
You can also gain some control over the tooltip width by using a non-breaking space (Ctrl-Shift-Space, which inserts a 0xc2a0 character) instead of a normal space.
Monday, 15 September 2014
Adobe LiveCycle Designer Tip #6 - Subform Indicators
One of the new features of Designer ES2 was Subform Indicators. These are the green subform icons that appeared on the Design view. Also as part of ES2 there was new option under the View menu to turn them off, which I did straight away as I didn’t see the use of them.
So if you are like me and did not realised that you can click on them to select the subform, you might what to give them another go. They are particularly useful when you have many subforms sharing a top edge.

Now all we need is an indicator to allow us to select an exclGroup
So if you are like me and did not realised that you can click on them to select the subform, you might what to give them another go. They are particularly useful when you have many subforms sharing a top edge.
Now all we need is an indicator to allow us to select an exclGroup
Thursday, 3 July 2014
Adobe LiveCycle Designer Tip #5 - Palette Control
Designer has 16 different palettes, a design surface and a script editor window. In an ideal world we would have two screens so we can spread them all out.
For those of us with only one screen moving from palette to palette can be a pain. If you have them docked at the sides then you'll need to click the 'thumb' controls to expand, which I find a bit of a small target to click on.

What I find easier is to have the palettes in one palette window. I have the Hierarchy, Data View, Style Catalog, Info, Font, Paragraph, Drawing Aids, Style Catalog on the left and Object, Layout, Border, Accessibility, Object Library, Fragment Library on the right.
To drag a palette onto another palette window drag the palette tab (not the palette title bar) on top of the target palette.

You can then end up with a layout looking like;

Which gives me a bigger target to click on.
For those of us with only one screen moving from palette to palette can be a pain. If you have them docked at the sides then you'll need to click the 'thumb' controls to expand, which I find a bit of a small target to click on.
What I find easier is to have the palettes in one palette window. I have the Hierarchy, Data View, Style Catalog, Info, Font, Paragraph, Drawing Aids, Style Catalog on the left and Object, Layout, Border, Accessibility, Object Library, Fragment Library on the right.
To drag a palette onto another palette window drag the palette tab (not the palette title bar) on top of the target palette.
You can then end up with a layout looking like;
Which gives me a bigger target to click on.
Wednesday, 23 April 2014
Adobe LiveCycle Designer Tip #4 - Setting Breakpoints
Debugging a Designer form can be frustrating for people used to other environments. With a Designer form you often have to add console.println(...) calls to your code so you can work out what is going on. However, you can do most of the things you expect with a debugger, but there are a few tricks.
First you can only debug JavaScript, there is no support for debugging FormCalc scripts. Second, you can only set breakpoints in event handlers, you can step into a script object but you can't set a breakpoint in one and the JavaScript debugger will not show you the code being debugged. It will at least show you which line number you are on and the JavaScript debugger console will allow you to display the values of form object properties and variables.
To set a breakpoint you must open the form in Acrobat, the Preview PDF within Designer does not seem to support all the debugging functionality available. The simplest way to do this is to perform a Preview PDF, Designer will generate a temporary file in your temp directory with a random name. So in Adobe Acrobat you can go File ... Open ... then type "%temp%" (without the quotes) in the File name field click the open button and find the most recent PDF file with a randomly generated name something like "_165o26cev28fbb2ut.pdf".
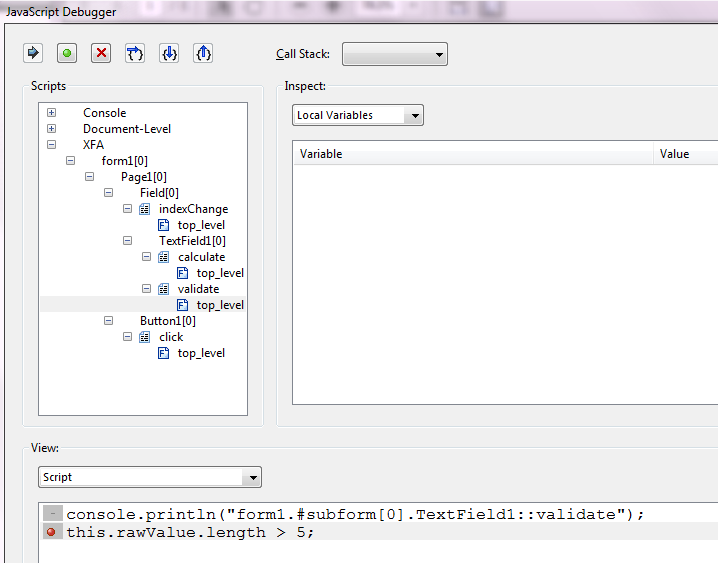
Once open in Acrobat the JavaScript debugger will now display the Hierarchy of the form, you will be able the expand the XFA node and navigate to a piece of event code and set a breakpoint, like this one on line 2 of the validate event of TextField1, just click where the red dot is.
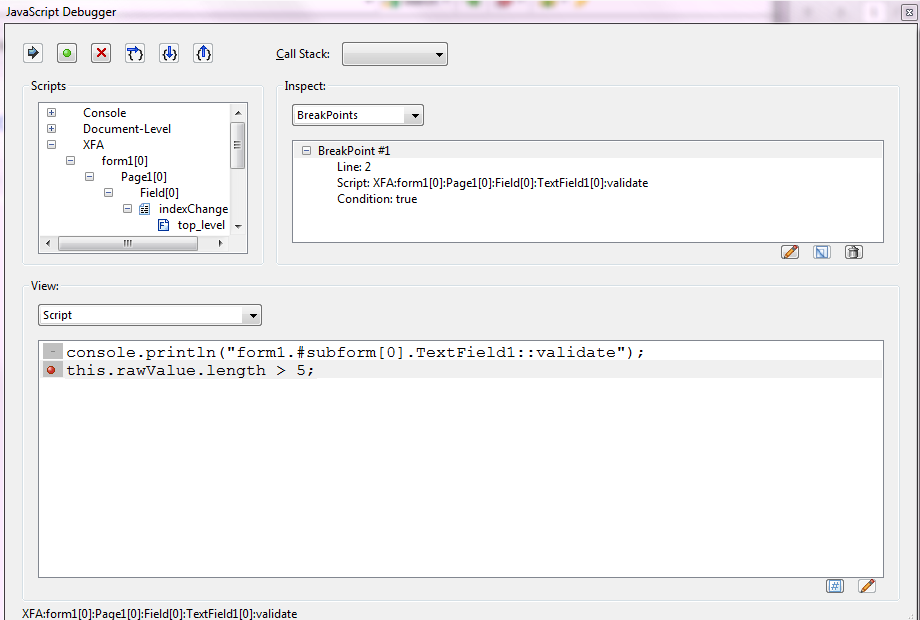
To see all the breakpoints you have set select BreakPoints in the Inspect: drop down (which will have defaulted to Local Variables), this will display all the current breakpoints, in this case we only have one so it looks like;
If you want to make the breakpoint conditional, select the breakpoint and click the edit button;

This will bring up a "change the breakpoint condition to:" dialog, like;

The default condition is true (so always breaks) but you can enter any JavaScript expression that resolves to true or false. So in this example we could type this.rawValue.length == 3 and the breakpoint will only be hit when we validate the field and it has a three character long value.
You can also list all the breakpoints using the JavaScript console. In the View drop down select console and type the following (to execute select the snippet and use the Ctrl-Enter on the numeric keypad);
This will display something like;
({fileName:"XFA:form1[0]:Page1[0]:Field[0]:TextField1[0]:validate", lineNum:2, condition:"this.rawValue.length == 3"})
Then you can use the following to clear the breakpoint
dbg.cb({fileName:"XFA:form1[0]:Page1[0]:Field[0]:TextField1[0]:validate", lineNum:2})
And to set the breakpoint again you can use;
dbg.sb({fileName:"XFA:form1[0]:Page1[0]:Field[0]:TextField1[0]:validate", lineNum:2, condition:"this.rawValue.length == 3"})
The dbg object also has methods for step into, step over, step out, etc but it is generally easier to use the toolbar of the JavaScript Debugger.
First you can only debug JavaScript, there is no support for debugging FormCalc scripts. Second, you can only set breakpoints in event handlers, you can step into a script object but you can't set a breakpoint in one and the JavaScript debugger will not show you the code being debugged. It will at least show you which line number you are on and the JavaScript debugger console will allow you to display the values of form object properties and variables.
To set a breakpoint you must open the form in Acrobat, the Preview PDF within Designer does not seem to support all the debugging functionality available. The simplest way to do this is to perform a Preview PDF, Designer will generate a temporary file in your temp directory with a random name. So in Adobe Acrobat you can go File ... Open ... then type "%temp%" (without the quotes) in the File name field click the open button and find the most recent PDF file with a randomly generated name something like "_165o26cev28fbb2ut.pdf".
Once open in Acrobat the JavaScript debugger will now display the Hierarchy of the form, you will be able the expand the XFA node and navigate to a piece of event code and set a breakpoint, like this one on line 2 of the validate event of TextField1, just click where the red dot is.
To see all the breakpoints you have set select BreakPoints in the Inspect: drop down (which will have defaulted to Local Variables), this will display all the current breakpoints, in this case we only have one so it looks like;
If you want to make the breakpoint conditional, select the breakpoint and click the edit button;
This will bring up a "change the breakpoint condition to:" dialog, like;
The default condition is true (so always breaks) but you can enter any JavaScript expression that resolves to true or false. So in this example we could type this.rawValue.length == 3 and the breakpoint will only be hit when we validate the field and it has a three character long value.
You can also list all the breakpoints using the JavaScript console. In the View drop down select console and type the following (to execute select the snippet and use the Ctrl-Enter on the numeric keypad);
for ( var i = 0; i < dbg.bps.length; i++ )
{
console.println(dbg.bps[i].toSource());
}
{
console.println(dbg.bps[i].toSource());
}
This will display something like;
({fileName:"XFA:form1[0]:Page1[0]:Field[0]:TextField1[0]:validate", lineNum:2, condition:"this.rawValue.length == 3"})
Then you can use the following to clear the breakpoint
dbg.cb({fileName:"XFA:form1[0]:Page1[0]:Field[0]:TextField1[0]:validate", lineNum:2})
And to set the breakpoint again you can use;
dbg.sb({fileName:"XFA:form1[0]:Page1[0]:Field[0]:TextField1[0]:validate", lineNum:2, condition:"this.rawValue.length == 3"})
The dbg object also has methods for step into, step over, step out, etc but it is generally easier to use the toolbar of the JavaScript Debugger.
Watches
In the Inspect drop down there is also a Watches option this will allow you to enter any form object property or variable and watch the value change as you step thought your code.Friday, 17 January 2014
Adobe LiveCycle Designer Tip #3 - Checking your form bindings
The Report Palette is often forgotten hidden away at the bottom of the workspace, and the Binding tab of this palette is even more forgotten.
But this tab has several options for checking the bindings of your form, these are available when you click the palette menu button in the top right corner (circled in red in the image below).

This is the option I need as it shows the name of the form object and the data connection SOM expression.

This lists all the fields with global binding, obviously enough. But it also has a "Check Global Binding" button. This will check all fields with the same name have global binding checked.
 Designer seems pretty good at checking this as binding changes are made so I am not sure in what scenarios this error occurs, but if you are using global binding and it's not working this would be a good place to start. (I only got this error because I was editing the XML Source).
Gives a quick check that you have bound all the fields that you need to.
These are the fields that are passed to a web service call.
Theses are fields that are bound to the result of a web service call.
This is the opposite of Fields with No Data Binding, gives a quick check which nodes in the data connection have not yet been bound to a form object.
This option also lists all the bindings that are set using the setProperty element. This element allows most other form object properties to be set similar to dynamic property binding but are not supported by the Designer user interface.
This is particularly handy as they can only be added using the XML Source view and can easily be forgotten. So if I wanted to set the presence of a form field using a value in the data connection I could add <setProperty target="presence" ref="$.presence"/> in the XML Source, where target is the form object property and ref is the data connection reference.
You can also use setProperty to refer to values that are not in the default data connection, values you don't want to be part of the form submission, such as <setProperty target="assist.toolTip" ref="!toolTips.value"> , note the data connection reference uses the "!" character which is the same as xfa.datasets. so toolTips is a dataset at the same level as the default data one.
But this tab has several options for checking the bindings of your form, these are available when you click the palette menu button in the top right corner (circled in red in the image below).

Fields with Normal Data Binding
This is the default, but a binding option I have never really used. All my forms are bound to a schema, so this tab has always been empty for me and for years totally ignored.
Fields with Data Binding by Reference
This is the option I need as it shows the name of the form object and the data connection SOM expression.
Fields with Global Data Binding
This lists all the fields with global binding, obviously enough. But it also has a "Check Global Binding" button. This will check all fields with the same name have global binding checked.
Fields with No Data Binding
Gives a quick check that you have bound all the fields that you need to.
Fields with Import Data Binding
These are the fields that are passed to a web service call.
Fields with Export Data Binding
Theses are fields that are bound to the result of a web service call.
Unbound Data Connection Nodes
This is the opposite of Fields with No Data Binding, gives a quick check which nodes in the data connection have not yet been bound to a form object.Objects with Dynamic Property Binding
This lists all the dynamic property bindings made for captions, list items and error messages.This option also lists all the bindings that are set using the setProperty element. This element allows most other form object properties to be set similar to dynamic property binding but are not supported by the Designer user interface.
This is particularly handy as they can only be added using the XML Source view and can easily be forgotten. So if I wanted to set the presence of a form field using a value in the data connection I could add <setProperty target="presence" ref="$.presence"/> in the XML Source, where target is the form object property and ref is the data connection reference.
You can also use setProperty to refer to values that are not in the default data connection, values you don't want to be part of the form submission, such as <setProperty target="assist.toolTip" ref="!toolTips.value"> , note the data connection reference uses the "!" character which is the same as xfa.datasets. so toolTips is a dataset at the same level as the default data one.
Friday, 27 September 2013
Adobe LiveCycle Designer Tip #2 - Finding your code
With Designer ES3 came a couple of new options on the hierarchy palette menu, one to show an icon against each form element that contains code and another to show an icon if the form element is bound to a data connection.
The script indicator looks like a scroll and the binding indicator is the one we are used to in the Data View tab.

The script indicator looks like a scroll and the binding indicator is the one we are used to in the Data View tab.
Monday, 8 July 2013
Adobe LiveCycle Designer Tip #1
One line of code I add to every form is;
event.target.viewState = { pageViewLayoutMode:2, pageViewZoom:0.964 };
This bit of JavaScript I put in the docReady event of the top subform.
The first part, pageViewLayoutMode:2, has the same effect as selecting "Enable Scrolling" from the View ... Page Display menu. This allows the form to scroll smoothly, especially noticeable when there are large fields, like multiline text boxes or a list box close to the top or bottom of a page.
The second part, pageViewZoom:0.964, has become more important as more people have wide screens. The default zoom setting for Adobe Reader is fit to width, which with a wide screen can give a letterbox slot view of your form. If your form has only one page then you could set the zoom level to 100%, but if the form is longer then the vertical scroll bar down the side will take up enough space for a horizontal scroll bar to appear.
So setting the zoom level to 96.4% is as close to 100% you can go without the horizontal scroll bar appearing.
event.target.viewState = { pageViewLayoutMode:2, pageViewZoom:0.964 };
This bit of JavaScript I put in the docReady event of the top subform.
The first part, pageViewLayoutMode:2, has the same effect as selecting "Enable Scrolling" from the View ... Page Display menu. This allows the form to scroll smoothly, especially noticeable when there are large fields, like multiline text boxes or a list box close to the top or bottom of a page.
The second part, pageViewZoom:0.964, has become more important as more people have wide screens. The default zoom setting for Adobe Reader is fit to width, which with a wide screen can give a letterbox slot view of your form. If your form has only one page then you could set the zoom level to 100%, but if the form is longer then the vertical scroll bar down the side will take up enough space for a horizontal scroll bar to appear.
So setting the zoom level to 96.4% is as close to 100% you can go without the horizontal scroll bar appearing.
Subscribe to:
Posts (Atom)